About me

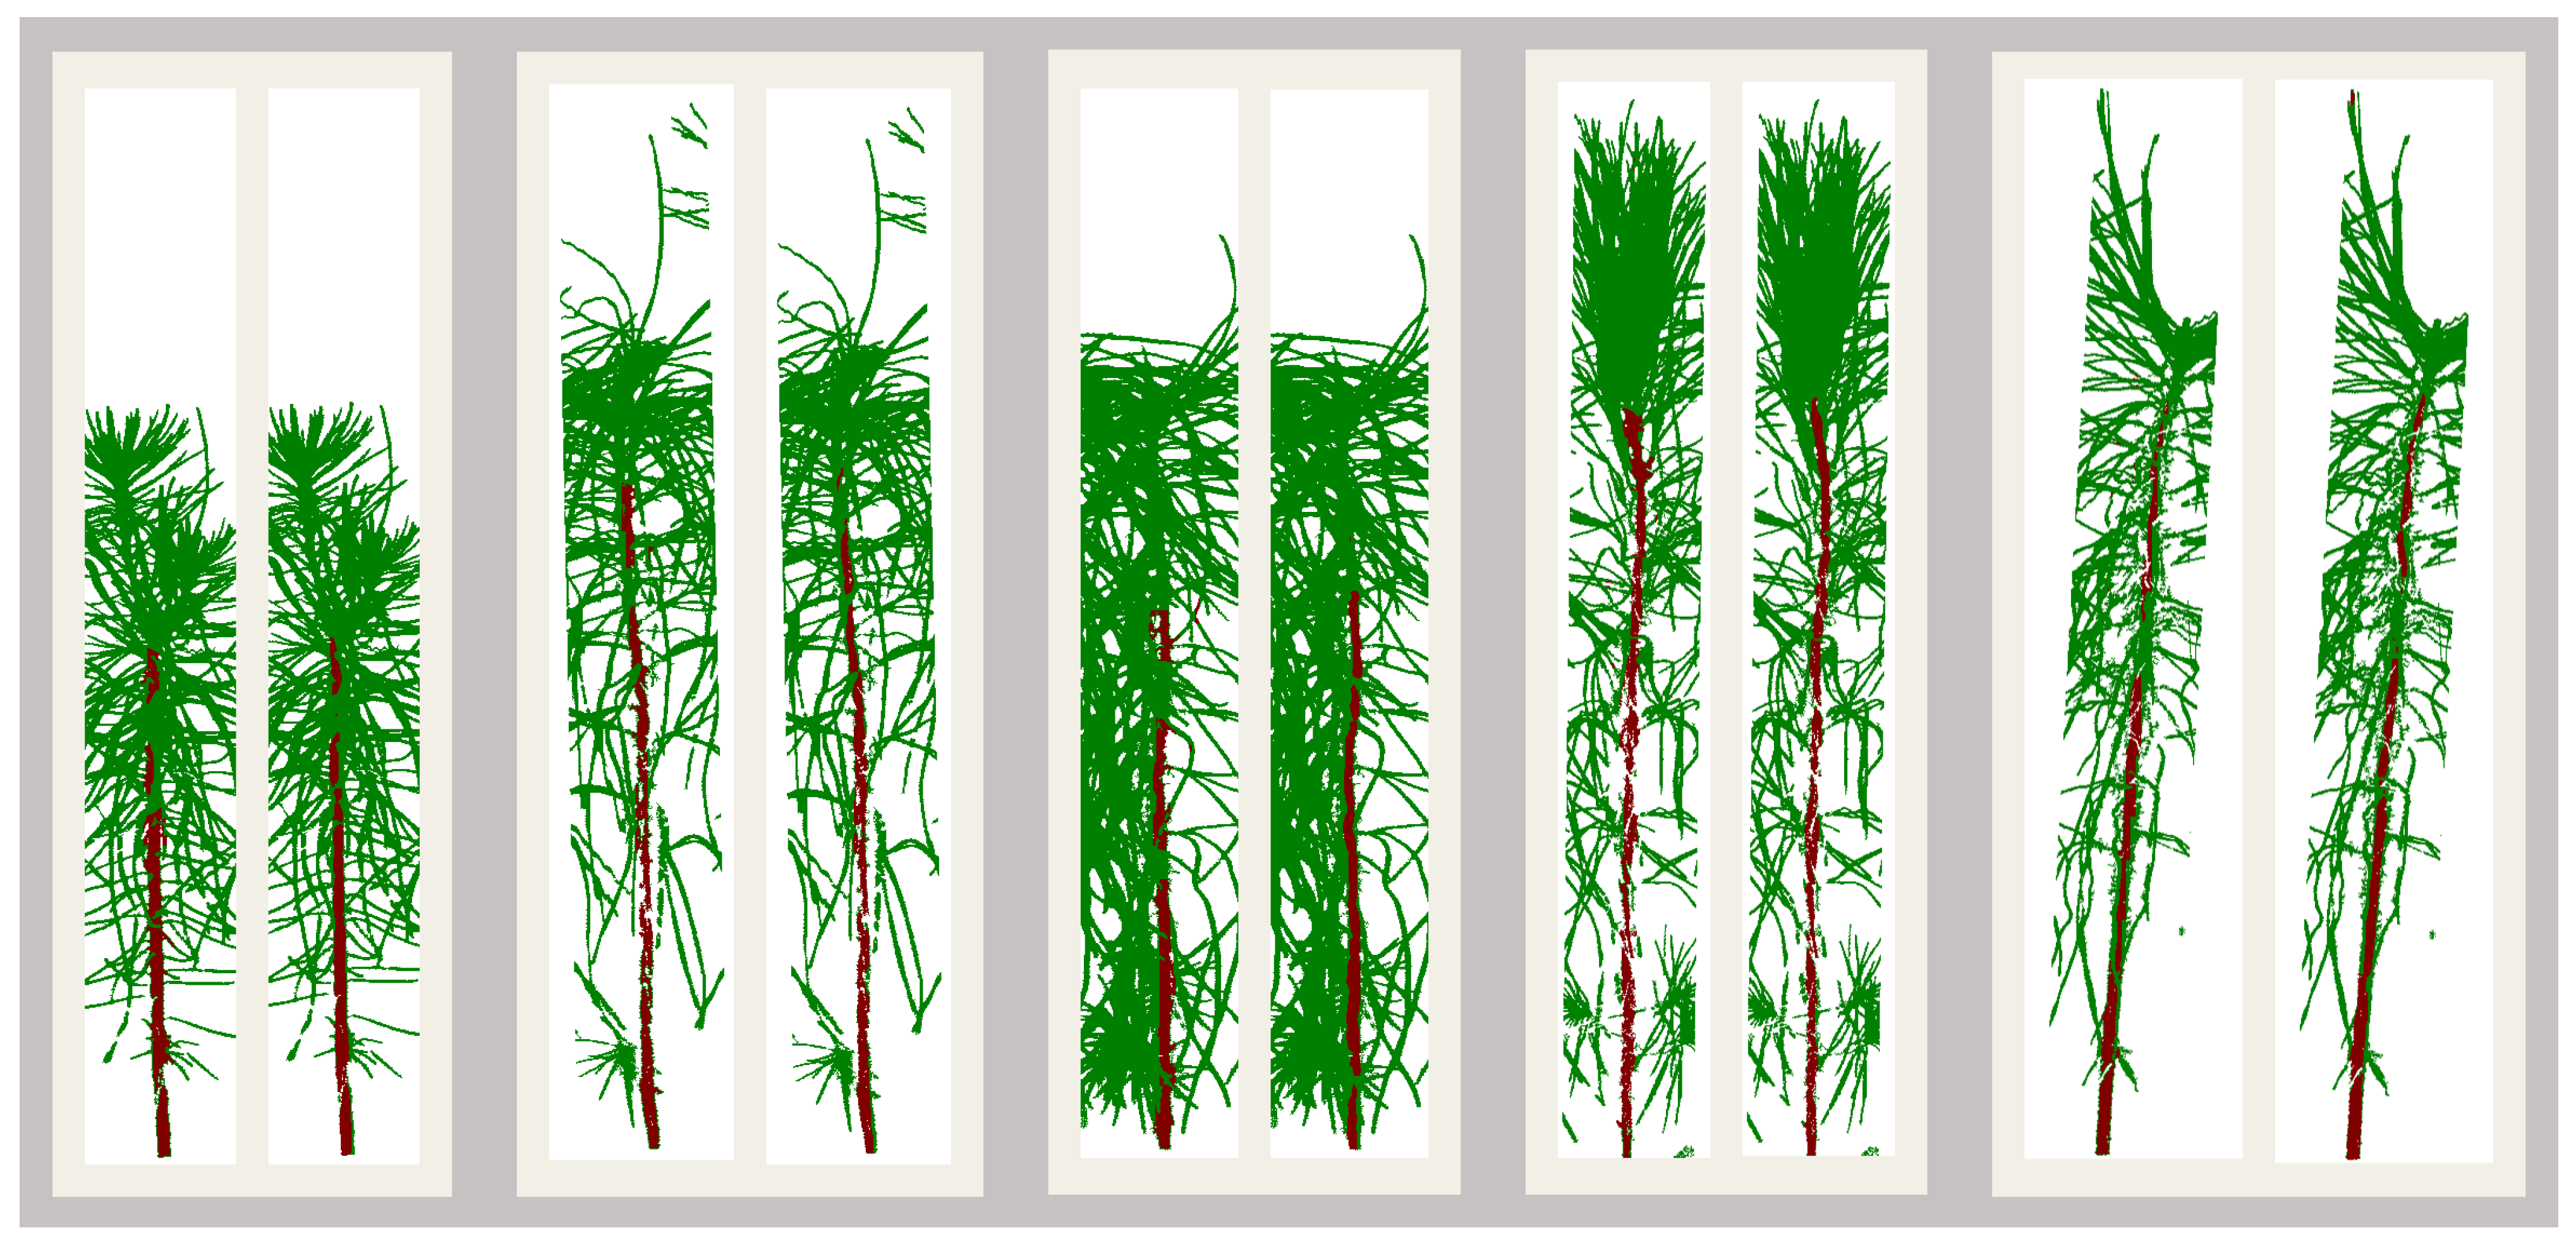
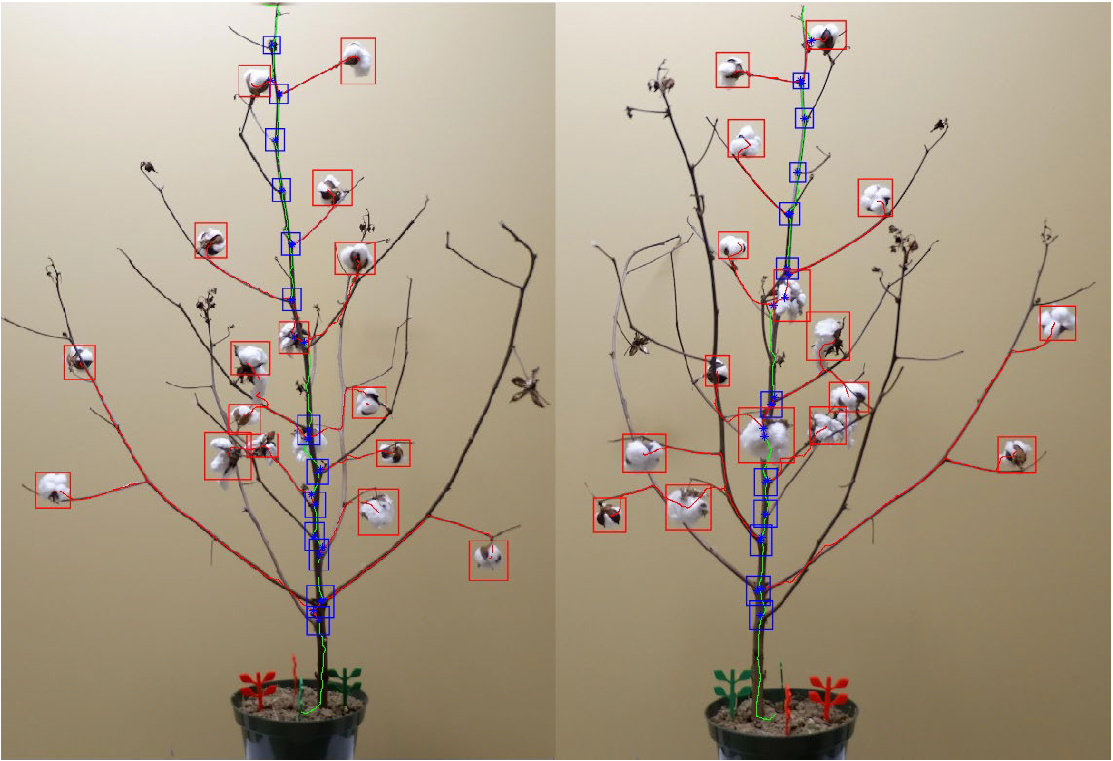
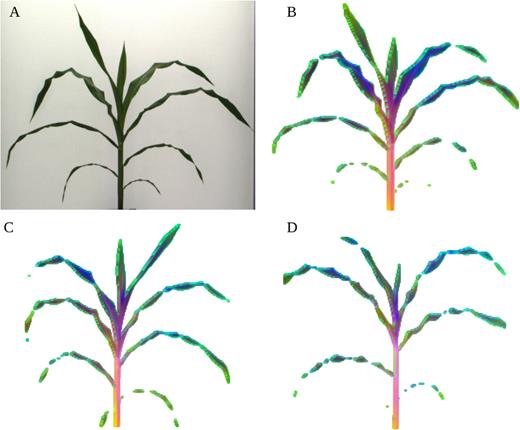
Hello. I am an ORISE postdoctoral fellow at USDA-ARS working with UAV images for maize plant phenotyping. I work with digital images to extract plant traits using computer vision and machine learning techniques. I also work on the development of robotic systems for agriculture and forestry applications. I completed my dual PhD in Engineering and Forestry from North Carolina State University in 2022.

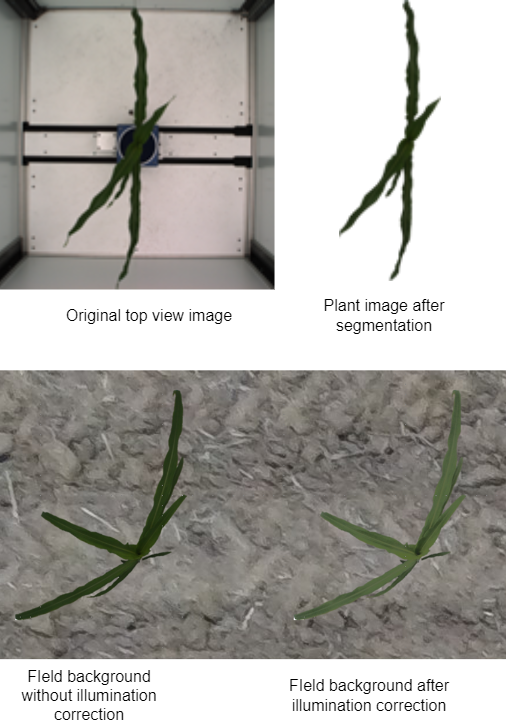
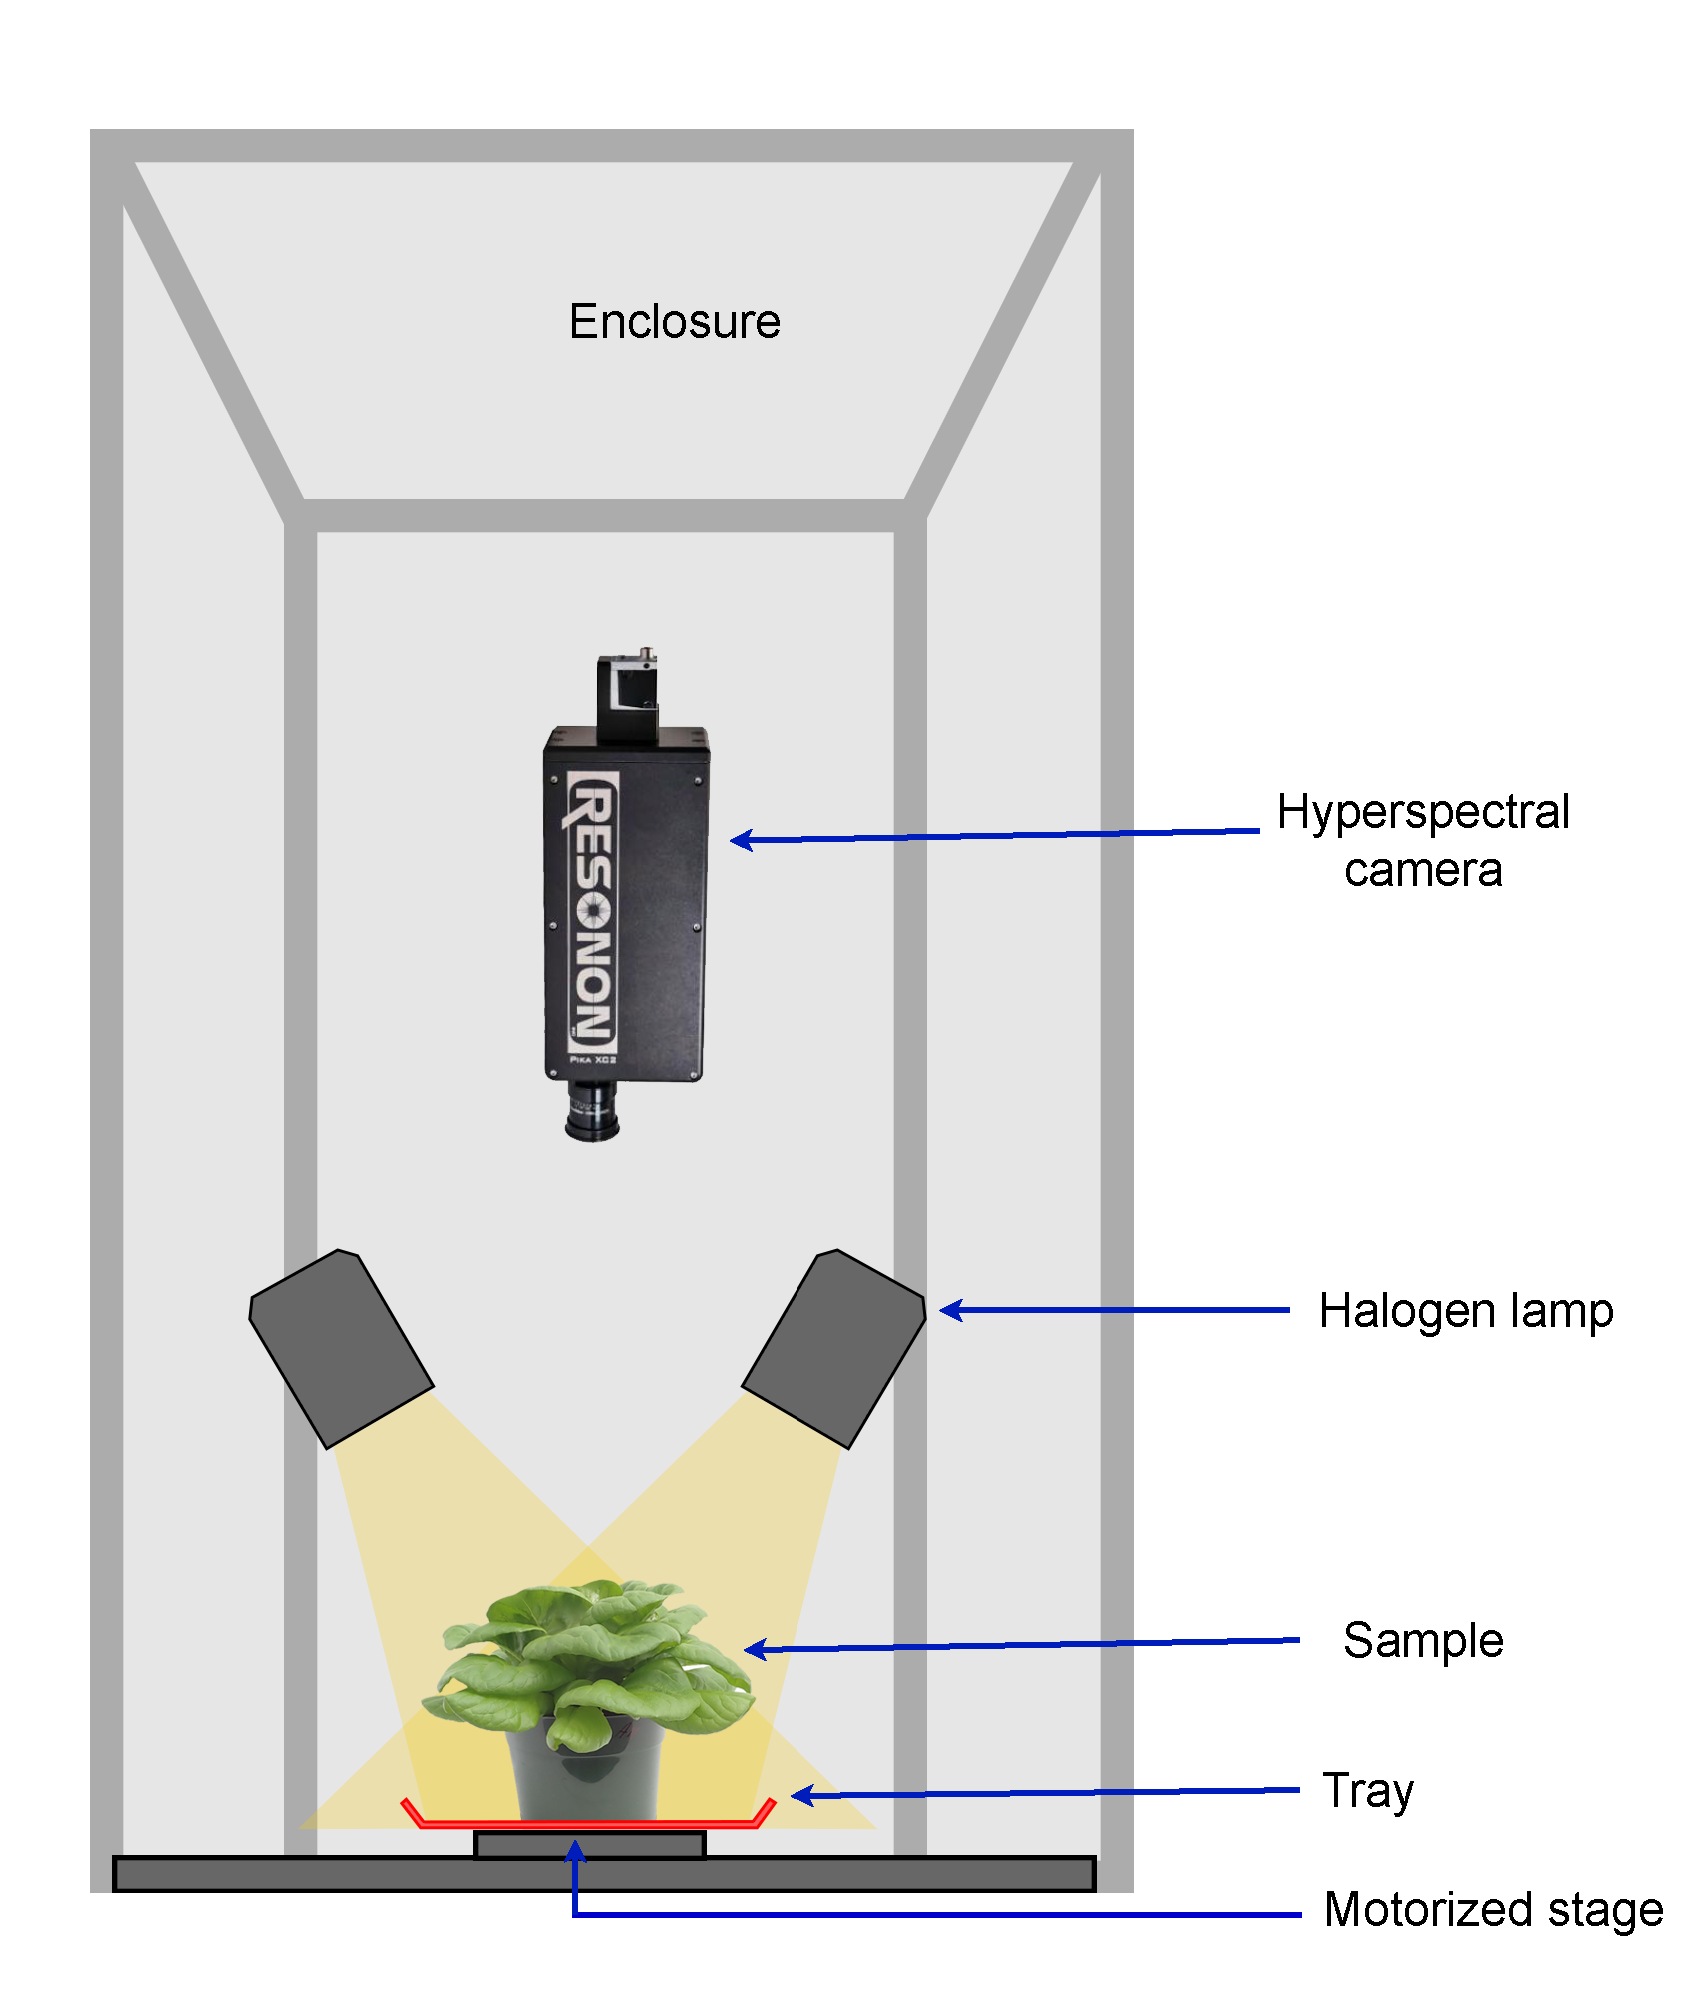
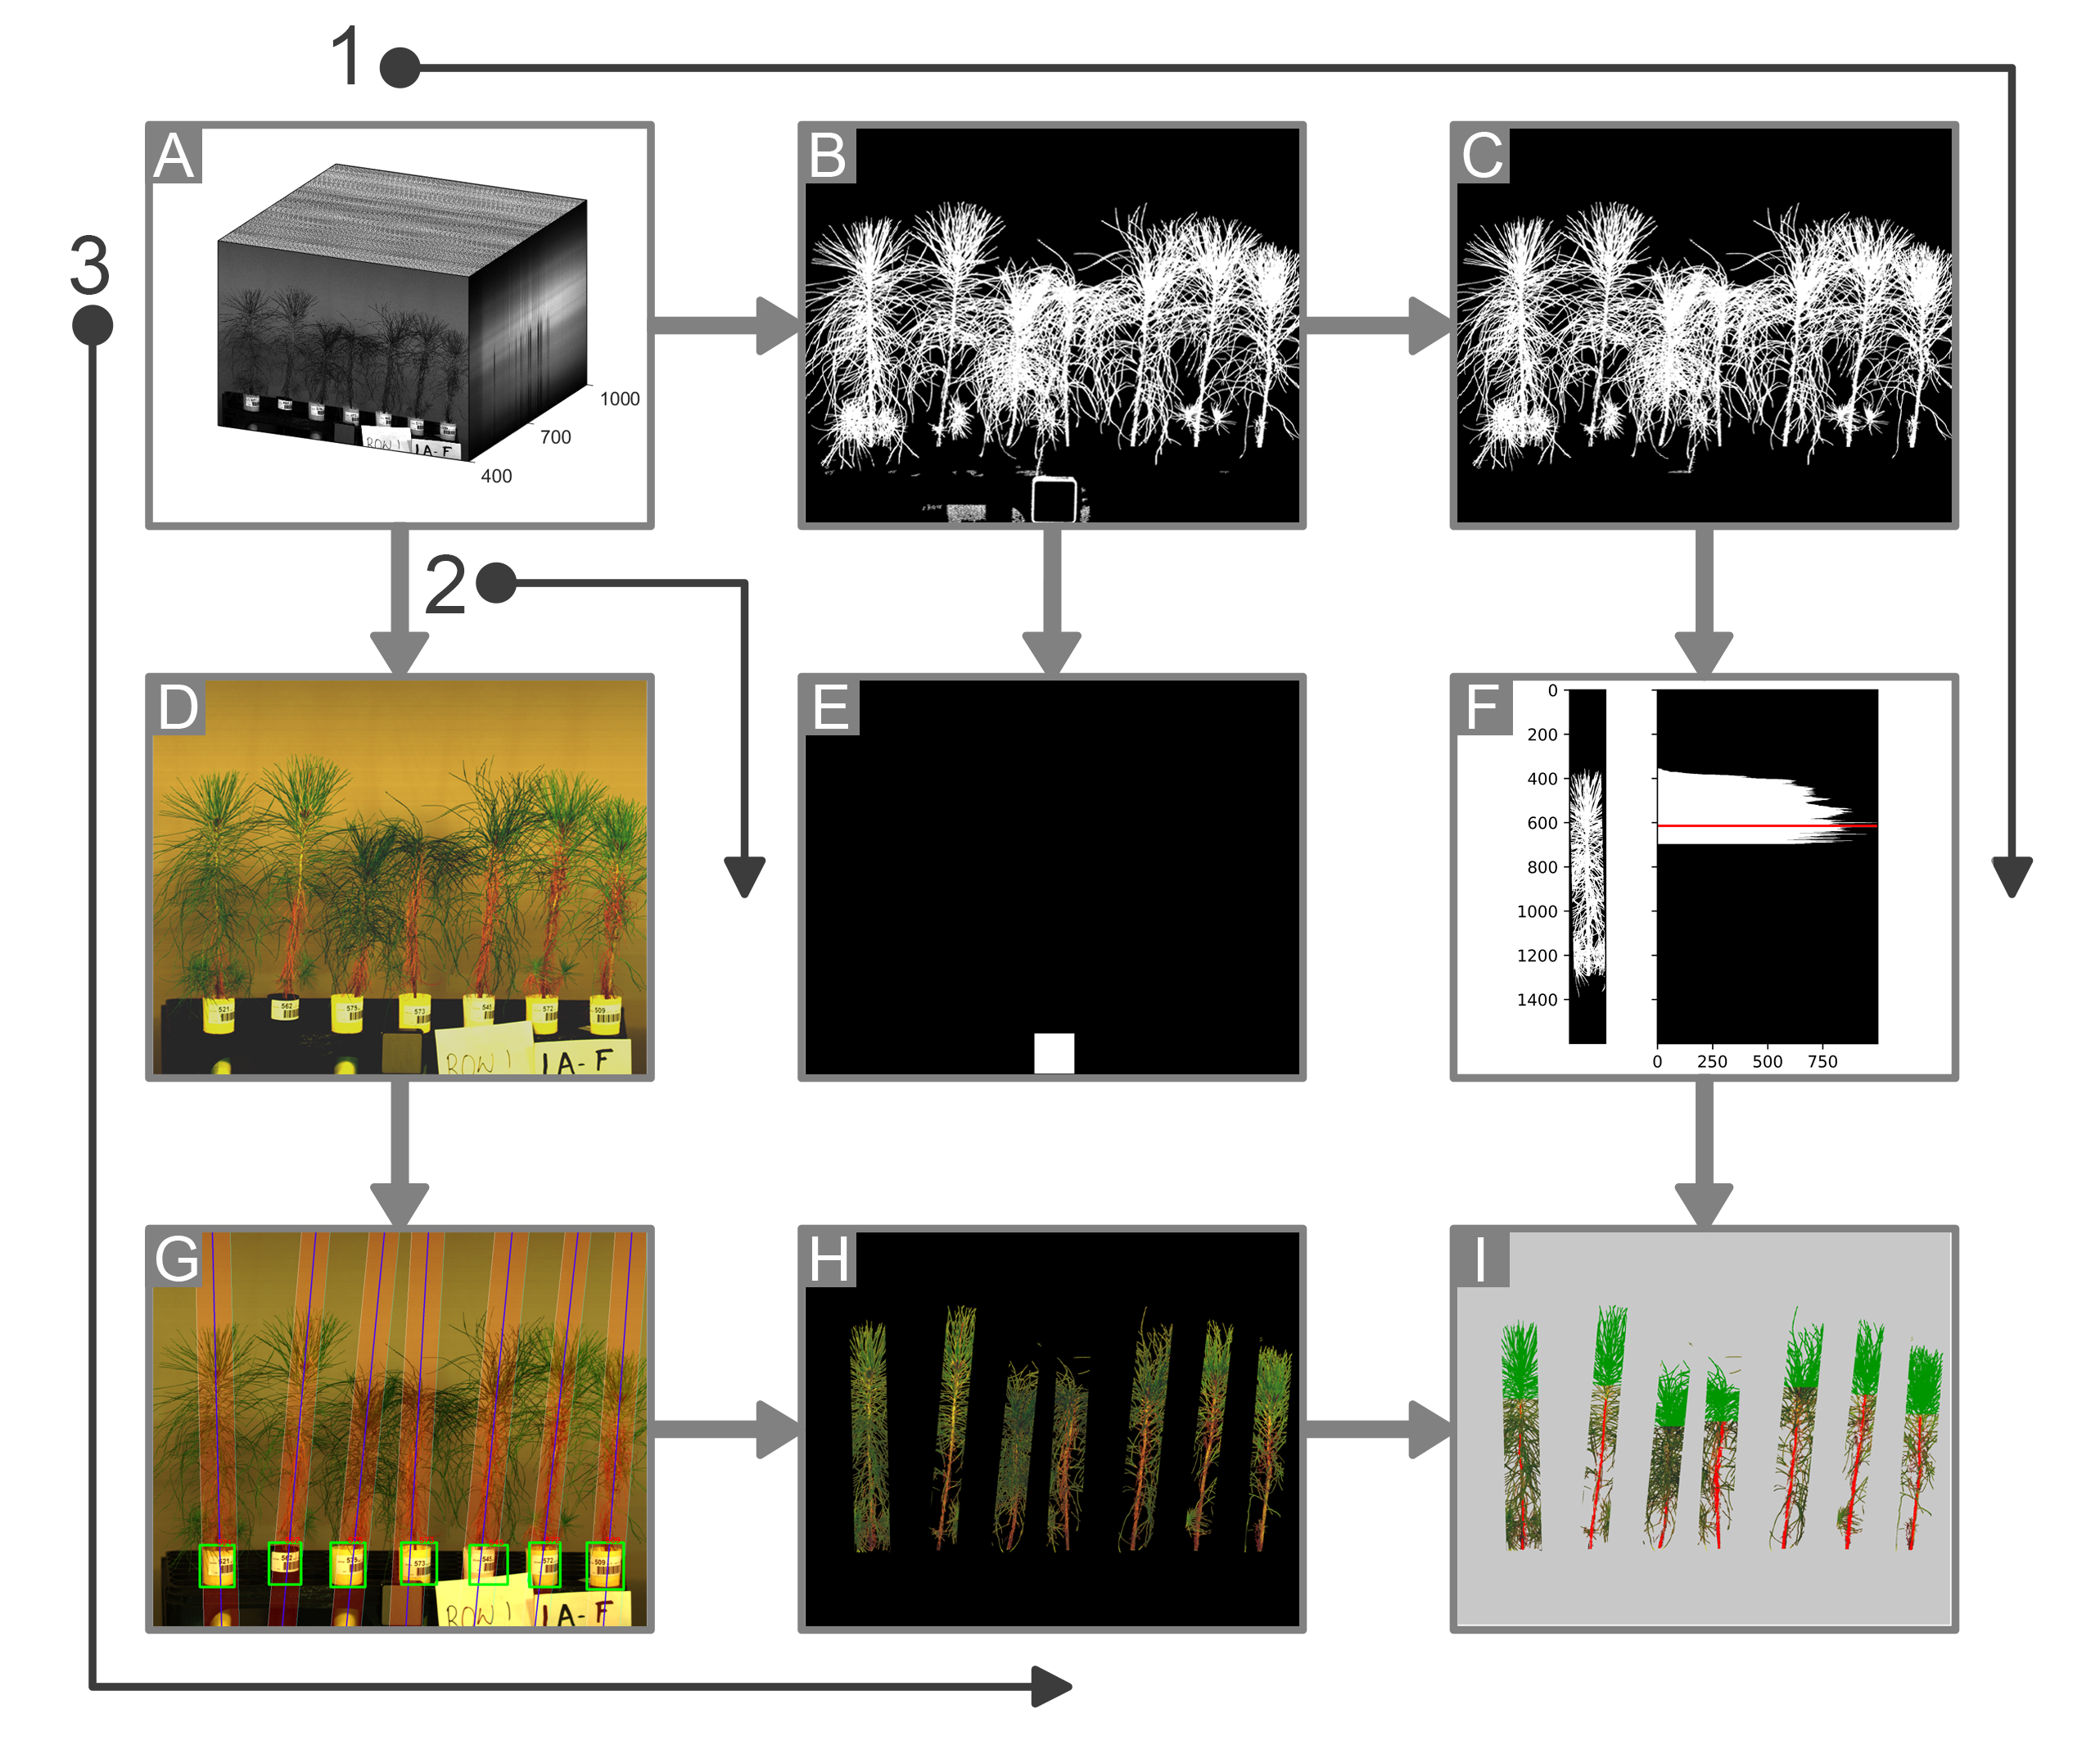
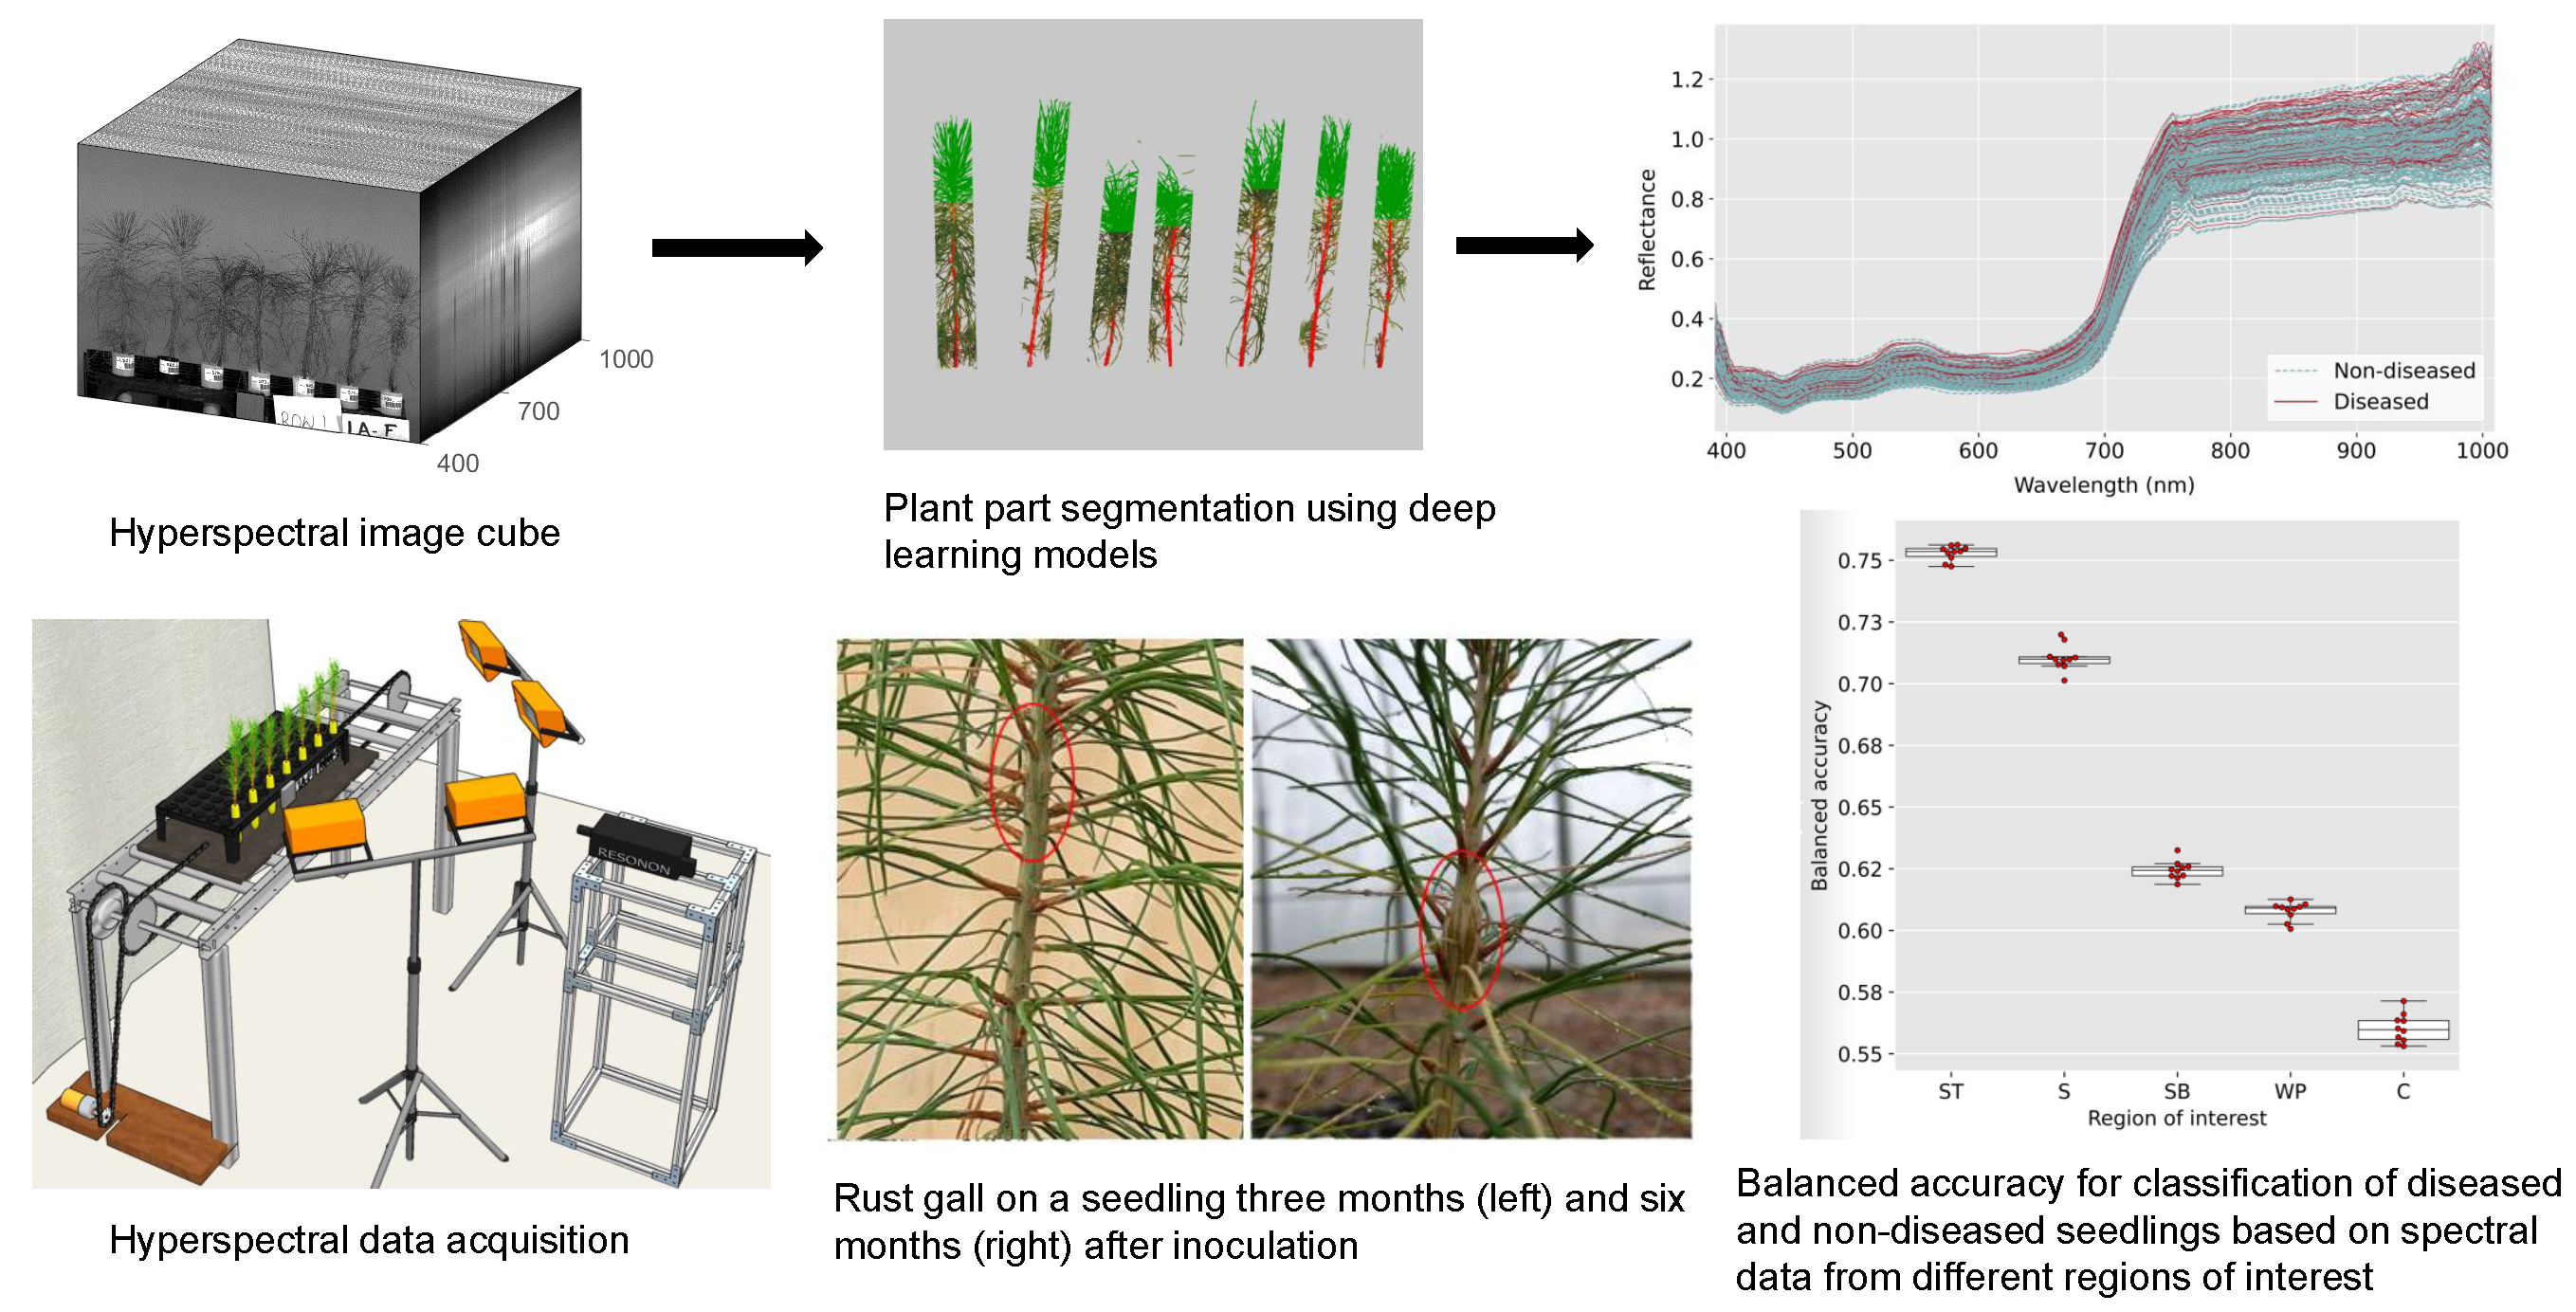
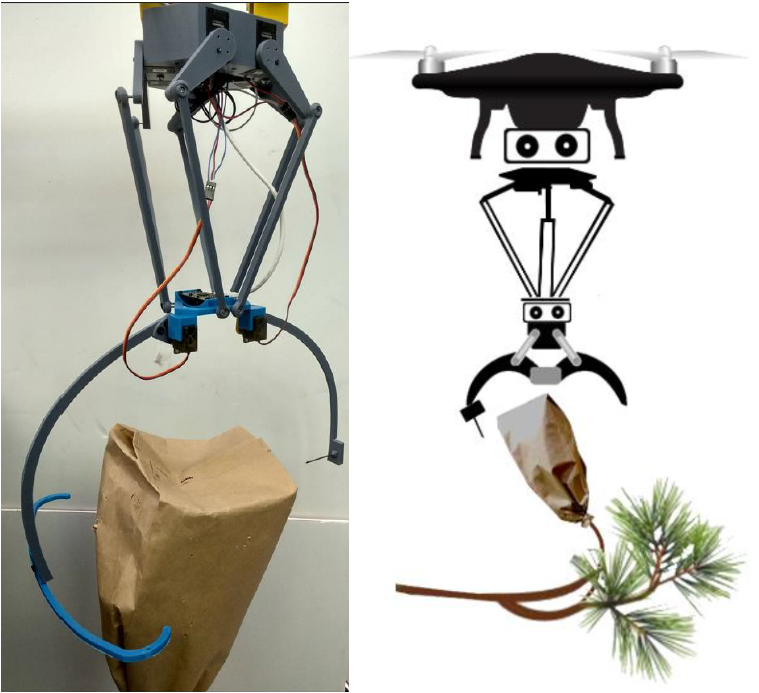
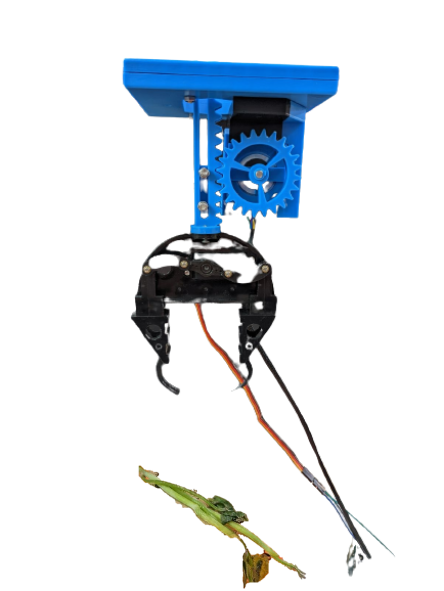
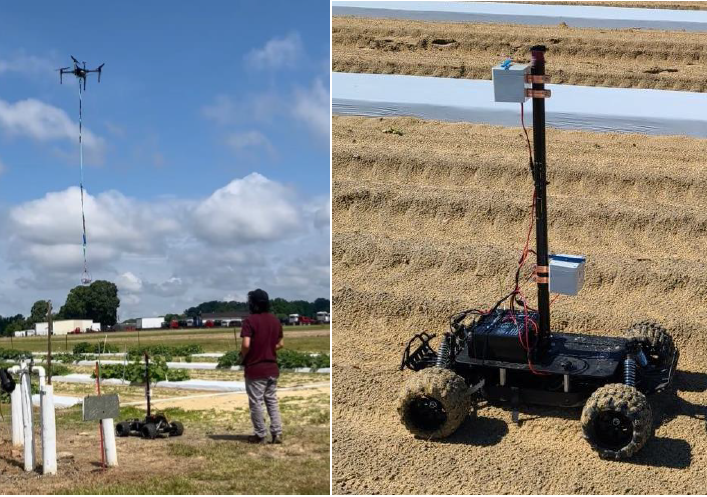
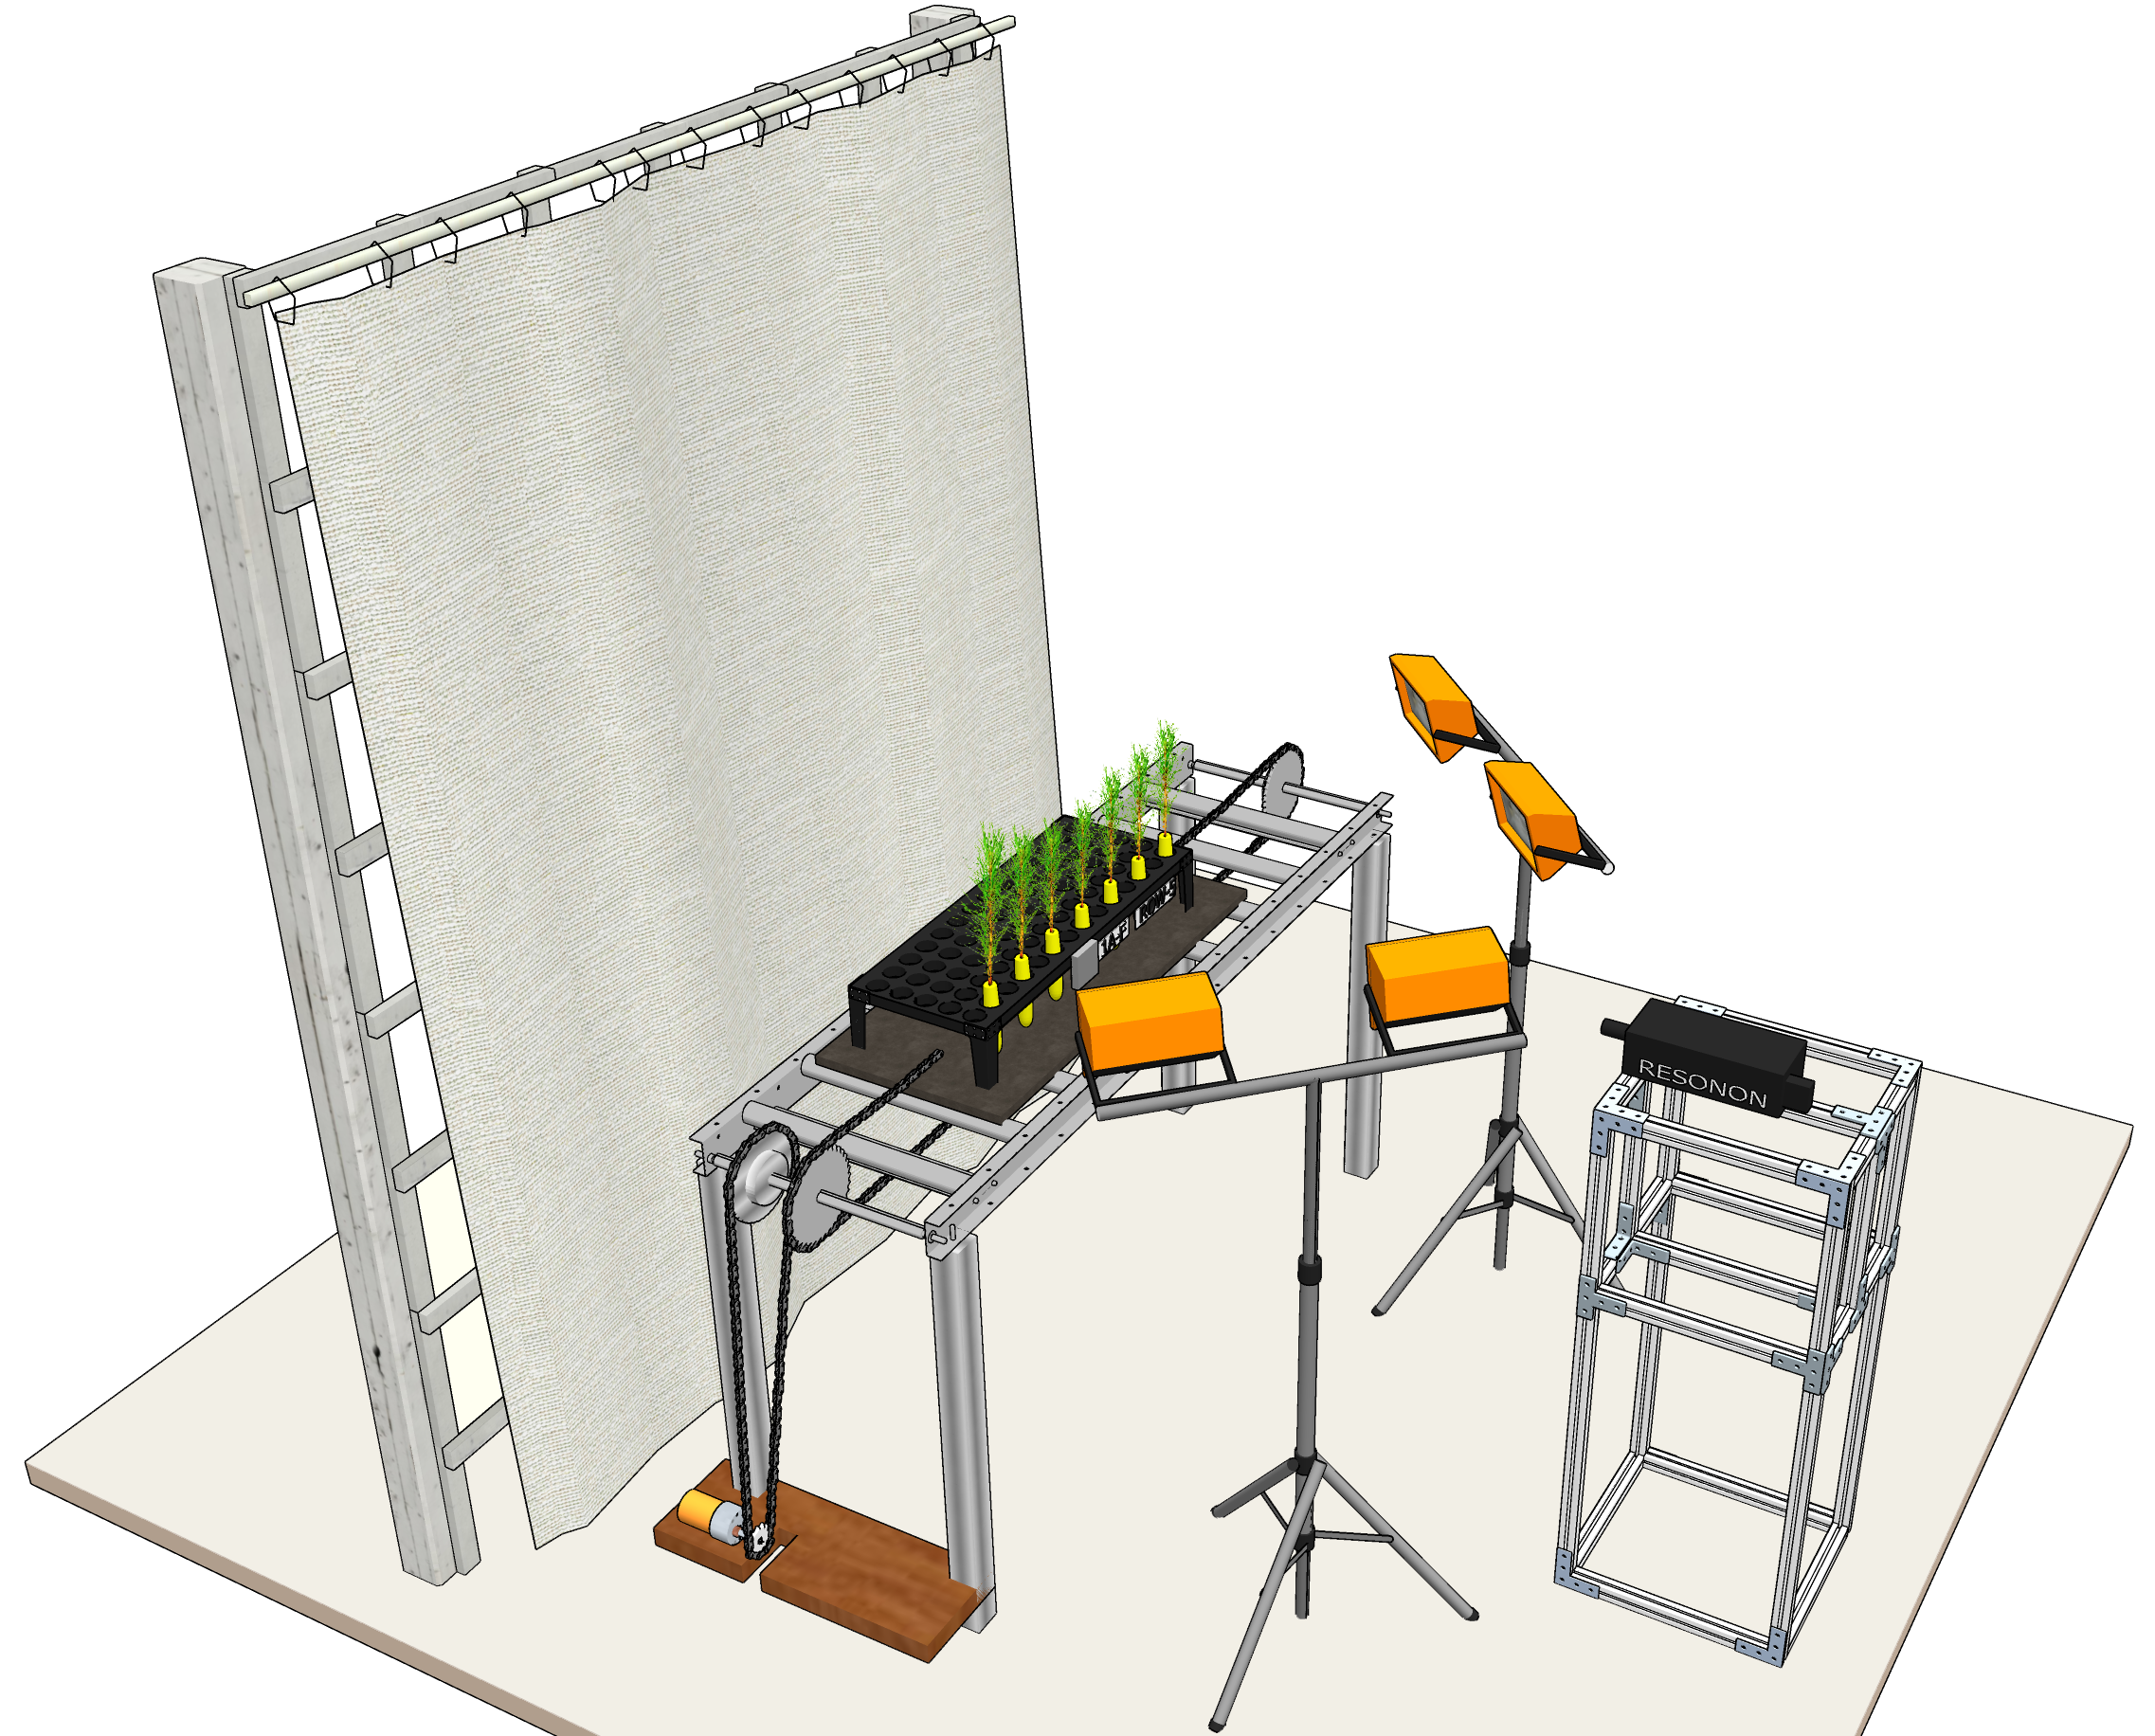
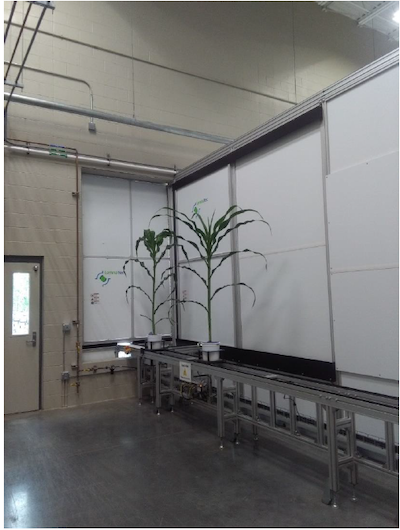
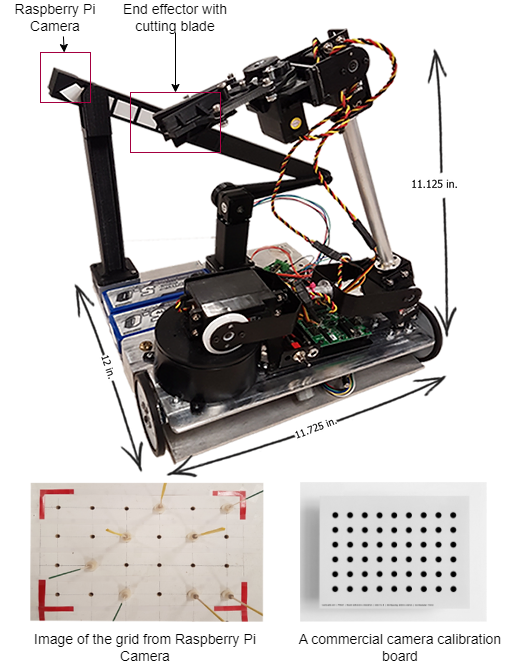
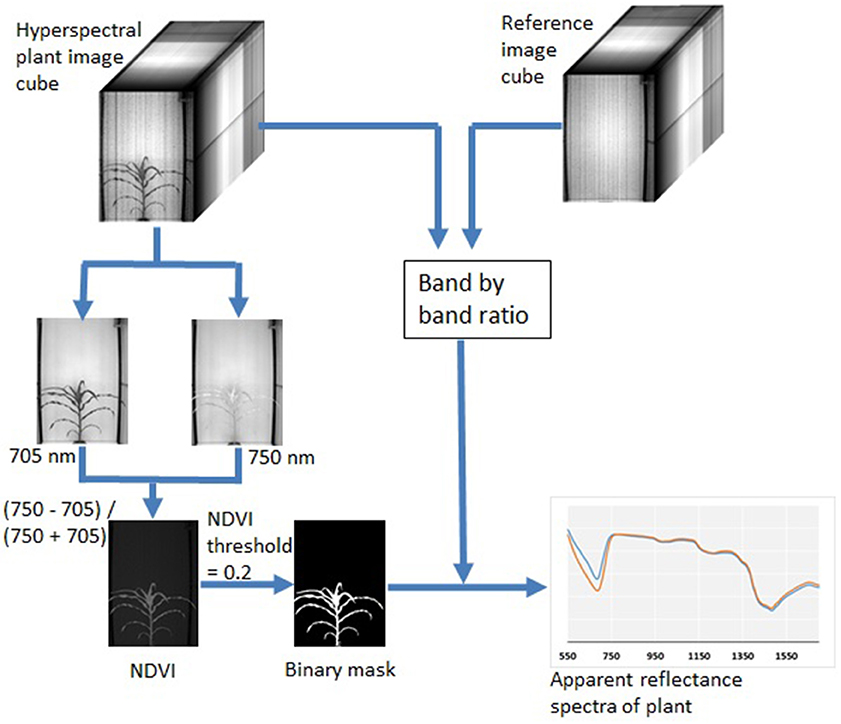
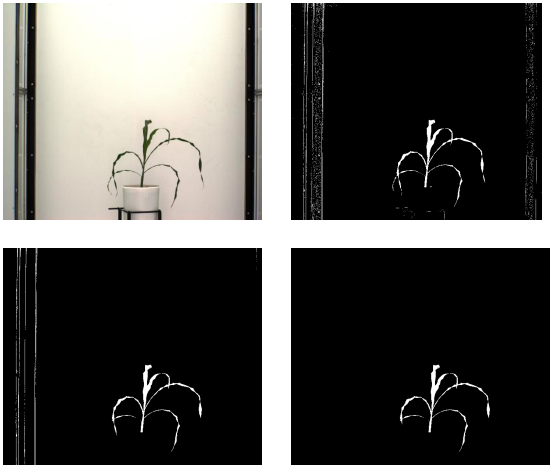
A large part of my work with plant images has been focused on the use of hyperspectral imaging to find optical signals of plant biotic and abiotic stress. At NC State, I developed a robotic pollination system for controlled pollination in loblolly pine seed orchards.

On this page, you will find a brief description of my projects with links for more information. Details on many of these projects are also accessible through my publications page.

Piyush Pandey

Synthetic UAV images for CNN model training (2023)

The detection of individual plants within UAV field images is critical for many applications in precision agriculture and research. Computer vision models for object detection, while often highly accurate, require large amounts of labeled data for training, something that is not readily available for most plants. To address the challenge of creating large datasets with accurate labels, we used indoor images of maize plants to create synthetic field images with automatically derived bounding box labels, enabling the generation of thousands of synthetic images without any manual labeling. Training an object detection model (Faster R-CNN) exclusively on synthetic images led to a mean average precision (mAP) value of 0.533 when the model was evaluated on pre-processed real plot images. When fine-tuned with a small number of real plot images, the model pre-trained on the synthetic images (mAP=0.884) outperformed the model that was not pre-trained.


Predicting lettuce nutrients using hyperspectral imaging (2021-2022)

This study investigated in situ hyperspectral imaging of hydroponic lettuce for predicting nutrient concentrations and identifying nutrient deficiencies for: nitrogen (N), phosphorous (P), potassium (K), calcium (Ca), magnesium (Mg), and sulphur (S). Plants were imaged using a hyperspectral line scanner at six and eight weeks after transplanting, then plant tissue was sampled, and nutrient concentrations measured. Partial least squares regression (PLSR) models were developed to predict nutrient concentrations for each nutrient individually (PLS1) and for all six nutrient concentrations (PLS2). Several binary classification models were also developed to predict nutrient deficiencies. The PLS1 and PLS2 models predicted nutrient concentrations with R^2 values from 0.60-0.88 for N, P, K, and S, while results for Ca and Mg yielded R^2 values of 0.12-0.34, for both harvest dates. Similarly, plants deficient in N, P, K, and S were classified more accurately compared to plants deficient in Ca and Mg for both harvest dates, with F1 values (F-scores) ranging from 0.71 to 1.00, with the exception of K which had F1 scores of 0.40-0.67. Overall, results indicate that both leaf tissue nutrient concentration and nutrient deficiencies can be predicted using hyperspectral data collected in-vivo.

A journal article reporting these findings can be accessed here.


Hyperspectral imaging of loblolly pine seedlings to identify disease resistance (2020-2021)

Loblolly pine is an economically important timber species in the United States, with almost 1 billion seedlings produced annually. The most significant disease affecting this species is fusiform rust, caused by Cronartium quercuum f. sp. fusiforme. Testing for disease resistance in the greenhouse involves artificial inoculation of seedlings followed by visual inspection for disease incidence. An automated, high-throughput phenotyping method could improve both the efficiency and accuracy of the disease screening process. This study investigates the use of hyperspectral imaging for the detection of diseased seedlings. A nursery trial comprising families with known in-field rust resistance data was conducted, and the seedlings were artificially inoculated with fungal spores. Hyperspectral images in the visible and near-infrared region (400–1000 nm) were collected six months after inoculation. The disease incidence was scored with traditional methods based on the presence or absence of visible stem galls. The seedlings were segmented from the background by thresholding normalized difference vegetation index (NDVI) images, and the delineation of individual seedlings was achieved through object detection using the Faster RCNN model. Plant parts were subsequently segmented using the DeepLabv3+ model. The trained DeepLabv3+ model for semantic segmentation achieved a pixel accuracy of 0.76 and a mean Intersection over Union (mIoU) of 0.62. Crown pixels were segmented using geometric features. Support vector machine discrimination models were built for classifying the plants into diseased and non-diseased classes based on spectral data, and balanced accuracy values were calculated for the comparison of model performance. Averaged spectra from the whole plant (balanced accuracy = 61%), the crown (61%), the top half of the stem (77%), and the bottom half of the stem (62%) were used. A classification model built using the spectral data from the top half of the stem was found to be the most accurate, and resulted in an area under the receiver operating characteristic curve (AUC) of 0.83.

This is the abstract of a published article that can be accessed here.


Robotic pollination for controlled crosses in loblolly pine (2021-2022)

As part of my PhD research, I worked on the development of a prototype pollinating robot comprised of a parallel manipulator with a pollen injecting mechanism and a perception system equipped with a stereovision camera. From preliminary tests conducted with the prototype, it was quickly identified that the most important problem in delivering pollen into exclusion bags was the successful insertion of the pollinator needle into the bag. A ``claw'' mechanism with a stabilizing link and a pollinator link was developed for this purpose. A simple spring-based mechanism for the verification of needle insertion was also developed and tested. The perception system is aimed at delivering pollen inside an exclusion bag once the pollinating device has been brought into close proximity of the bag such that the needle can be inserted with manipulator motion within its workspace. In order to recognize the location of the target exclusion bag, an object detection model was trained for the detection of the bags. The depth information from the stereovision camera was combined with the bounding box data obtained from the bag detection model to calculate the position of the exclusion bag. The software for image acquisition and processing was developed using the Robot Operating System (ROS).

More details about this project can be found here and here.


Robotic manipulation of sweet potato slips (2021-2022)

This mini-project was focused on prototyping a sweet potato slip handling system. This was aimed at automating slip handling during sweet potato planting. I worked on the creation of an imaging system to develop a computer vision system that can accurately determine the position of individual slip. I used a Mynt Eye stereo camera was used, and created a simple GUI using R-QT to trigger the camera and record images. The mechanical system needed a manipulator to pick up the delicate slips. I designed some end effector geometries in Solidworks and 3D printed them for tests. I also later supervised an undergraduate student to further develop this project for picking up the slips.


Downy mildew spore trap on ground rover and UAV (2021-2022)

I worked on creating a mobile spore trapping system to mount on a ground rover and a UAV to detect downy mildew. As shown in the image, the UAV trap was designed to be mounted on a tether. This was part of an ongoing effort at North Carolina State University to create a portable and cost effective solution for downy mildew detection in cucurbit farms.


Cold tolerance of loblolly pine using hyperspectral imaging (2019-2020)

The most important climatic variable influencing growth and survival of loblolly pine is the yearly average minimum winter temperature (MWT) at the seed source origin, and it is used to guide the transfer of improved seed lots throughout the species’ distribution. This study presents a novel approach for the assessment of freeze-induced damage and prediction of MWT at seed source origin of loblolly pine seedlings using hyperspectral imaging. A population comprising 98 seed lots representing a wide range of MWT at seed source origin was subjected to an artificial freeze event. The visual assessment of freeze damage and MWT were evaluated at the family level and modeled with hyperspectral image data combined with chemometric techniques. Hyperspectral scanning of the seedlings was conducted prior to the freeze event and on four occasions periodically after the freeze. A significant relationship (R2 = 0.33; p < .001) between freeze damage and MWT was observed. Prediction accuracies of freeze damage and MWT based on hyperspectral data varied among seedling portions (full-length, top, middle, and bottom portion of aboveground material) and scanning dates. Models based on the top portion were the most predictive of both freeze damage and MWT. The highest prediction accuracy of MWT [RPD (ratio of prediction to deviation) = 2.12, R2 = 0.78] was achieved using hyperspectral data obtained prior to the freeze event. Adoption of this assessment method would greatly facilitate the characterization and deployment of well-adapted loblolly pine families across the landscape.

This is the abstract of a journal article that can be found here.


Cotton plant architecture through object detection using deep learning models (2018)

In this study, I explored the use of deep learning methods for the detection of key plant organs in cotton plants, followed by further processing of the acquired results to derive semantic information 38 about the cotton plant. As a preliminary study, the detection of cotton bolls and main stalk nodes is studied, followed by the use of this minimal information to derive detailed information about the plant structure. The parameters that we attempt to derive include boll production per node, internodal distances, and branch angles.

The results of this study can be accessed here.


Sorghum phenotypes using RGB, hyperspectral images (2017)

This study with sorghum images was a part of my MS thesis at UNL. I used RGB images to study relative growth rate (RGR) and water use efficiency (WUE) of a diverse panel of 300 sorghum plants of 30 genotypes, and hyperspectral images for chemical analysis of macronutrients and cell wall composition. Half of the plants from each genotype were subjected to drought stress, while the other half were left unstressed. I created models to estimate the shoot fresh and dry weights from plant projected area. RGR values for the drought-stressed plants were found to gradually lag behind the values for the unstressed plants whereas WUE values were highly variable with time. Significant effects of drought stress and genotype were observed for both RGR and WUE. Hyperspectral image data (546 nm to 1700 nm) were used for chemical analysis of macronutrients (N, P, and K), neutral detergent fiber (NDF), and acid detergent fiber (ADF) for plant samples separated into leaf and three longitudinal sections of the stem. The accuracy of the models built using the spectrometer data (350 nm to 2500 nm) of dried and ground biomass was found to be higher than the accuracy of models built using the image data. For the image data, the models for N(R2 = 0.66, RPD = 1.72), and P(R2=0.52, RPD = 1.46) were found to be satisfactory for quantitative analysis whereas the models for K, NDF, and ADF were not suitable for quantitative prediction. Models built after the separation of leaf and stem samples showed variation in the accuracy between the two groups.

Details of this study can be found in my MS thesis here.


Time series imaging of maize lines used in field trials (2016-2017)

This was the result of a collaboration with plant geneticists at UNL where my contribution was primarily in the image processing, including hyperspectral data calibration and analysis. a set of maize inbreds—primarily recently off patent lines—were phenotyped using a high-throughput platform. These lines have been previously subjected to high-density genotyping and scored for a core set of 13 phenotypes in field trials across 13 North American states in 2 years by the Genomes 2 Fields Consortium. We released a total of 485 GB of image data including RGB, hyperspectral, fluorescence, and thermal infrared photos has been released. Correlations between image-based measurements and manual measurements demonstrated the feasibility of quantifying variation in plant architecture using image data. However, naive approaches to measuring traits such as biomass can introduce nonrandom measurement errors confounded with genotype variation. Analysis of hyperspectral image data demonstrated unique signatures from stem tissue. Integrating heritable phenotypes from high-throughput phenotyping data with field data from different environments can reveal previously unknown factors that influence yield plasticity. You will find more details in the publication here.


(Tabletop) raspberry cane pruning robot (2017)

This was a student robotics competition where I was a team member at the University of Nebraska - Lincoln. The robot was supposed to walk down the table and for every "plot" of "raspberry canes" on the table, it needed to trim only a certain number of green or yellow canes. We had a robot arm with blades on its end effector for cutting the canes and an articulated crank mechanism that would send a Raspberry Pi camera to the top of the plot for image acquisition.

I was in charge of the vision system and my specific responsibility was to use the images and produce 3D coordinates for each cane so that the arm could go and cut them. I was initially planning to use a depth camera but then realized that the grid of canes resembles a camera calibration checkerboard. The size of the grid and the distance between the canes was fixed, so once I detected the canes and the empty holes, all I needed was the camera intrinsics to find the 3D coordinates. We got the second prize in the competition.

The UNL news article about this competition can be found here.


In-vivo measurement of leaf chemical properties using hyperspectral imaging (2016-2017)

In 2016, I worked with the newly established Lemnatec Plant Phenotyping platform at UNL to calibrate the hyperspectral images and use maize and soybean images to predict leaft chemical properties. Among all the chemical properties investigated, water content was predicted with the highest accuracy [R2 = 0.93 and RPD (Ratio of Performance to Deviation) = 3.8]. All macronutrients were also quantified satisfactorily (R2 from 0.69 to 0.92, RPD from 1.62 to 3.62), with N predicted best followed by P, K, and S. The micronutrients group showed lower prediction accuracy (R2 from 0.19 to 0.86, RPD from 1.09 to 2.69) than the macronutrient groups. Cu and Zn were best predicted, followed by Fe and Mn. Na and B were the only two properties that hyperspectral imaging was not able to quantify satisfactorily (R2 < 0.3 and RPD < 1.2). You can read more about this project here.


Measuring plant fresh biomass with RGB images (2016)

Using RGB images to predict the fresh biomass of maize plants was my first project based on the analysis of plant images. I used MATLAB to segment the plant pixels and calculated the area covered by the plants in pixels and metric units. These values were then used to model for fresh biomass. The images used here were derived from the Lemnatec plant phenotyping greenhouse. When using the top view images for this purpose, since the camera was stationary, the plants gradually moved towards the camera. The plants are also getting bigger as they do this, but the distortion caused by the change in distance caused the accuracy of the model to drop. Using the side view images worked quite well. We also found differences in model accuracy for different genotypes. You can read more about this project in the paper here.